Module Development Guide
Up until this point we expect you completed the steps:
Configure The Development Environment for IDE of your choice.
This section focuses on the current best practices you can use when developing pipelines in Savant. We propose the process because we believe it is efficient, time-saving and brings the best user experience. We will highly appreciate if you share with us your experience and recommend improvements.
The section is in the beginning of the documentation to provide you with the introductory feeling; we understand that currently there are too many unknown concepts required to build the whole mindmap. It is absolutely a great idea to read carefully all “Savant 101” before practically developing pipelines.
Why Does It Matter?
In software development, dealing with inefficient tooling can be immensely frustrating. Consider the situation where a developer needs to introduce a minor change to the codebase. On the surface, this change appears simple. However, once executed, the developer is forced to endure a long build and run process. Those extended minutes of waiting, magnified by anticipation, often culminate in disappointment when the task fails. The next steps involve sifting through extensive logs, pinpointing the issue, and once again enduring the tedious cycle of change, build, and run. Such iterative loops disrupt workflow, waste precious time, and hinder productivity, highlighting the crucial importance of efficient tooling and streamlined processes.
That is what vanilla DeepStream is about. Imagine a developer adjusting a detection code in a DeepStream application for vehicle tracking. After this minor change, they must restart the entire pipeline to test it. Due to the complexity of video analytics, it takes considerable time to build and launch the pipeline, and process the frames. Once it introduces a corner case, the pipeline crashes. The developer now sifts through dense GStreamer and DeepStream logs to diagnose the issue. This iterative process—tweak, wait, crash, diagnose—becomes a tedious cycle, highlighting the need for efficient debugging tools in intricate platforms like DeepStream.
When we started Savant, we had incapable, inefficient tooling as DeepStream has. But in Savant 0.2.5, we made many improvements to give developers efficient tooling, disrupting the annoying “change, build, run, read logs” cycle. We want Savant developers to have tooling enabling building integration tests and discovering problems in seconds, not minutes.
To help develop modules efficiently Savant provides provides two features and one auxiliary technology:
Client SDK: a Python programmatic API allowing developers to send media and meta to Savant and receive the results right from Python programs without threads, complex logic, etc;
Dev Server: a feature enabling pipeline reloading Python code automatically on change, significantly saving the developer’s time working on Python code.
The above-mentioned auxiliary technology is OpenTelemetry. It is a broad topic, but for now, you may think that it helps profiling the code performance and collecting logs and events happening in the pipeline.
Let us observe basic operations you may encounter during the pipeline development and our approach to carry on them efficiently.
Recommended Module Layout
Small and medium-size pipelines can have a flat layout with all the components placed in a single directory. You can find a number of such pipelines in samples directory.
You don’t need to have a whole Savant repo to develop a module, only what is inside a module directory.
The my-module created from template has more universal structure suitable for advanced pipelines with dependencies. Let us discuss the structure briefly:
.devcontainer: the directory is required only if you are developing with VSCode; it contains Docker specification for VSCode. You may find two flavors there - for x86+dGPU and for Nvidia Jetson SOCs.
docker: the directory contains two Dockerfiles containing stub code for building custom development Docker containers, installing additional requirements from the
requirements.txt; it is often a way to go if the pipeline requires Python libraries not delivered with Savant base images..dockerignore: the file contains exclusions for files and paths typically must be avoided to add to a Docker image; you can extend them to reflect your actual needs, e.g. exclude media files.
Makefile contains commands for building and launching the Docker image in a standalone mode, without IDE.
README.md is just a README stub.
requirements.txt contains additional Python requirements to add to the custom Docker image.
src/module directory with actual pipeline code.
The module Directory
The module.yml contains pipeline manifest describing pipeline stages and properties. This is where you the structure and declarative behavior with predefined properties and specify custom Python invocations when you need domain-specific processing. You can think of it as of HTML with JavaScript blocks if you have web-development experience.
There are three Python files run.py, overlay.py, custom_pyfunc.py. Let us discuss them.
The file run.py is an auxiliary file used as a module entrypoint. Docker images are configure to use it. Also, you use it to run and stop the pipeline from IDE. For production deployments, you normally don’t need it, but you can use it to implement custom code initialization if necessary.
The file custom_pyfunc.py is a stub file for a pyfunc element which implements custom logic. You will find a lot of various pyfuncs in samples <https://github.com/insight-platform/Savant/tree/develop/samples>.
The file overlay.py represents a custom draw_func element used to customize video drawing functionality of Savant. It is usually used when you need to add some non-standard fancy graphics in your frames. The samples demonstrate custom draw_func implementations as well.
Rebuilding Docker Image
Warning
Rebuilding the Docker image and reconfiguring IDE for a new one is a really time-killing operation. Plan the development process to avoid doing that frequently.
Note
In this section we don’t distinguish between Dockerfile.l4t and Dockerfile.x86. Just keep in mind that when Dockerfile is mentioned, you must consider a variant, specific to your working environment.
Sometimes you may need to add components to Docker image. It could be a python requirement which you add to requirements.txt or a system utility specified immediately in Dockerfile build step. Whenever your changes affect Dockerfile you must rebuild it.
Rebuilding Dockerfile is done with:
make build
After the rebuilding Dockerfile you must apply changes in your IDE.
Using The New Image In IDE
PyCharm Professional
Changes to the Dockerfile or the base image
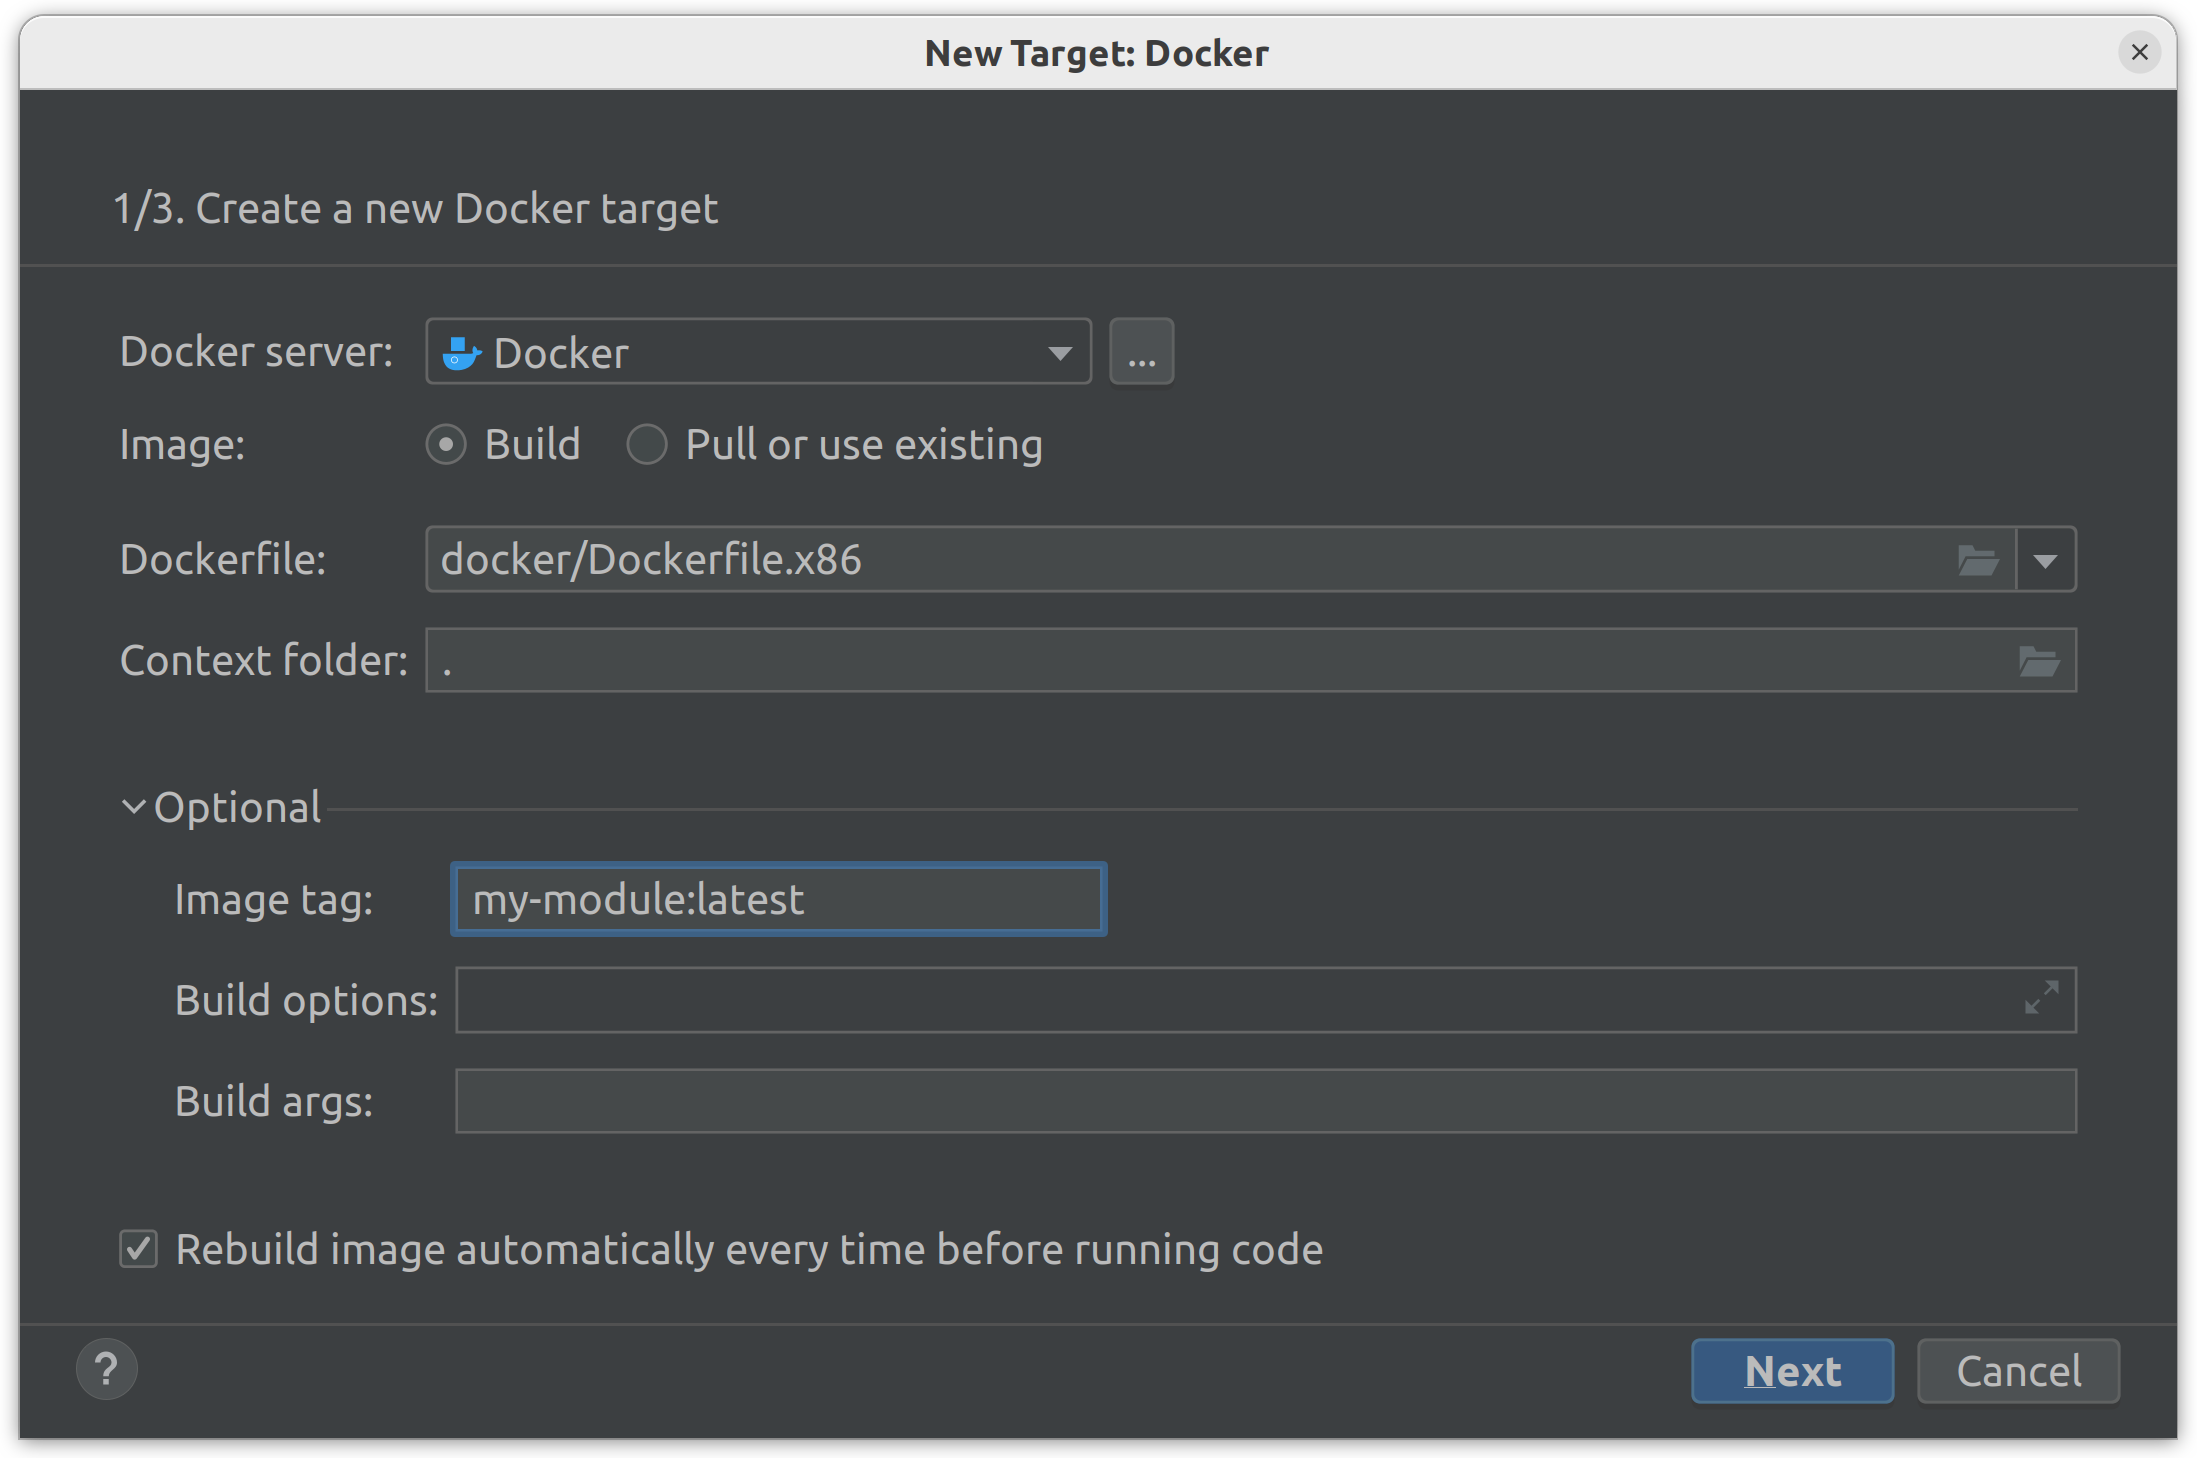
You should check that the “Rebuild image automatically every time before running code” option is enabled in the “Python interpreters” settings. If this option is enabled and you have made any changes to the Dockerfile or updated the base image, you don’t need to do anything else. At the next run a new image will be built and the container will be updated.
Adding new packages to requirements.txt
Once dependencies are added to the requirements.txt, they will be automatically installed when building a new image.
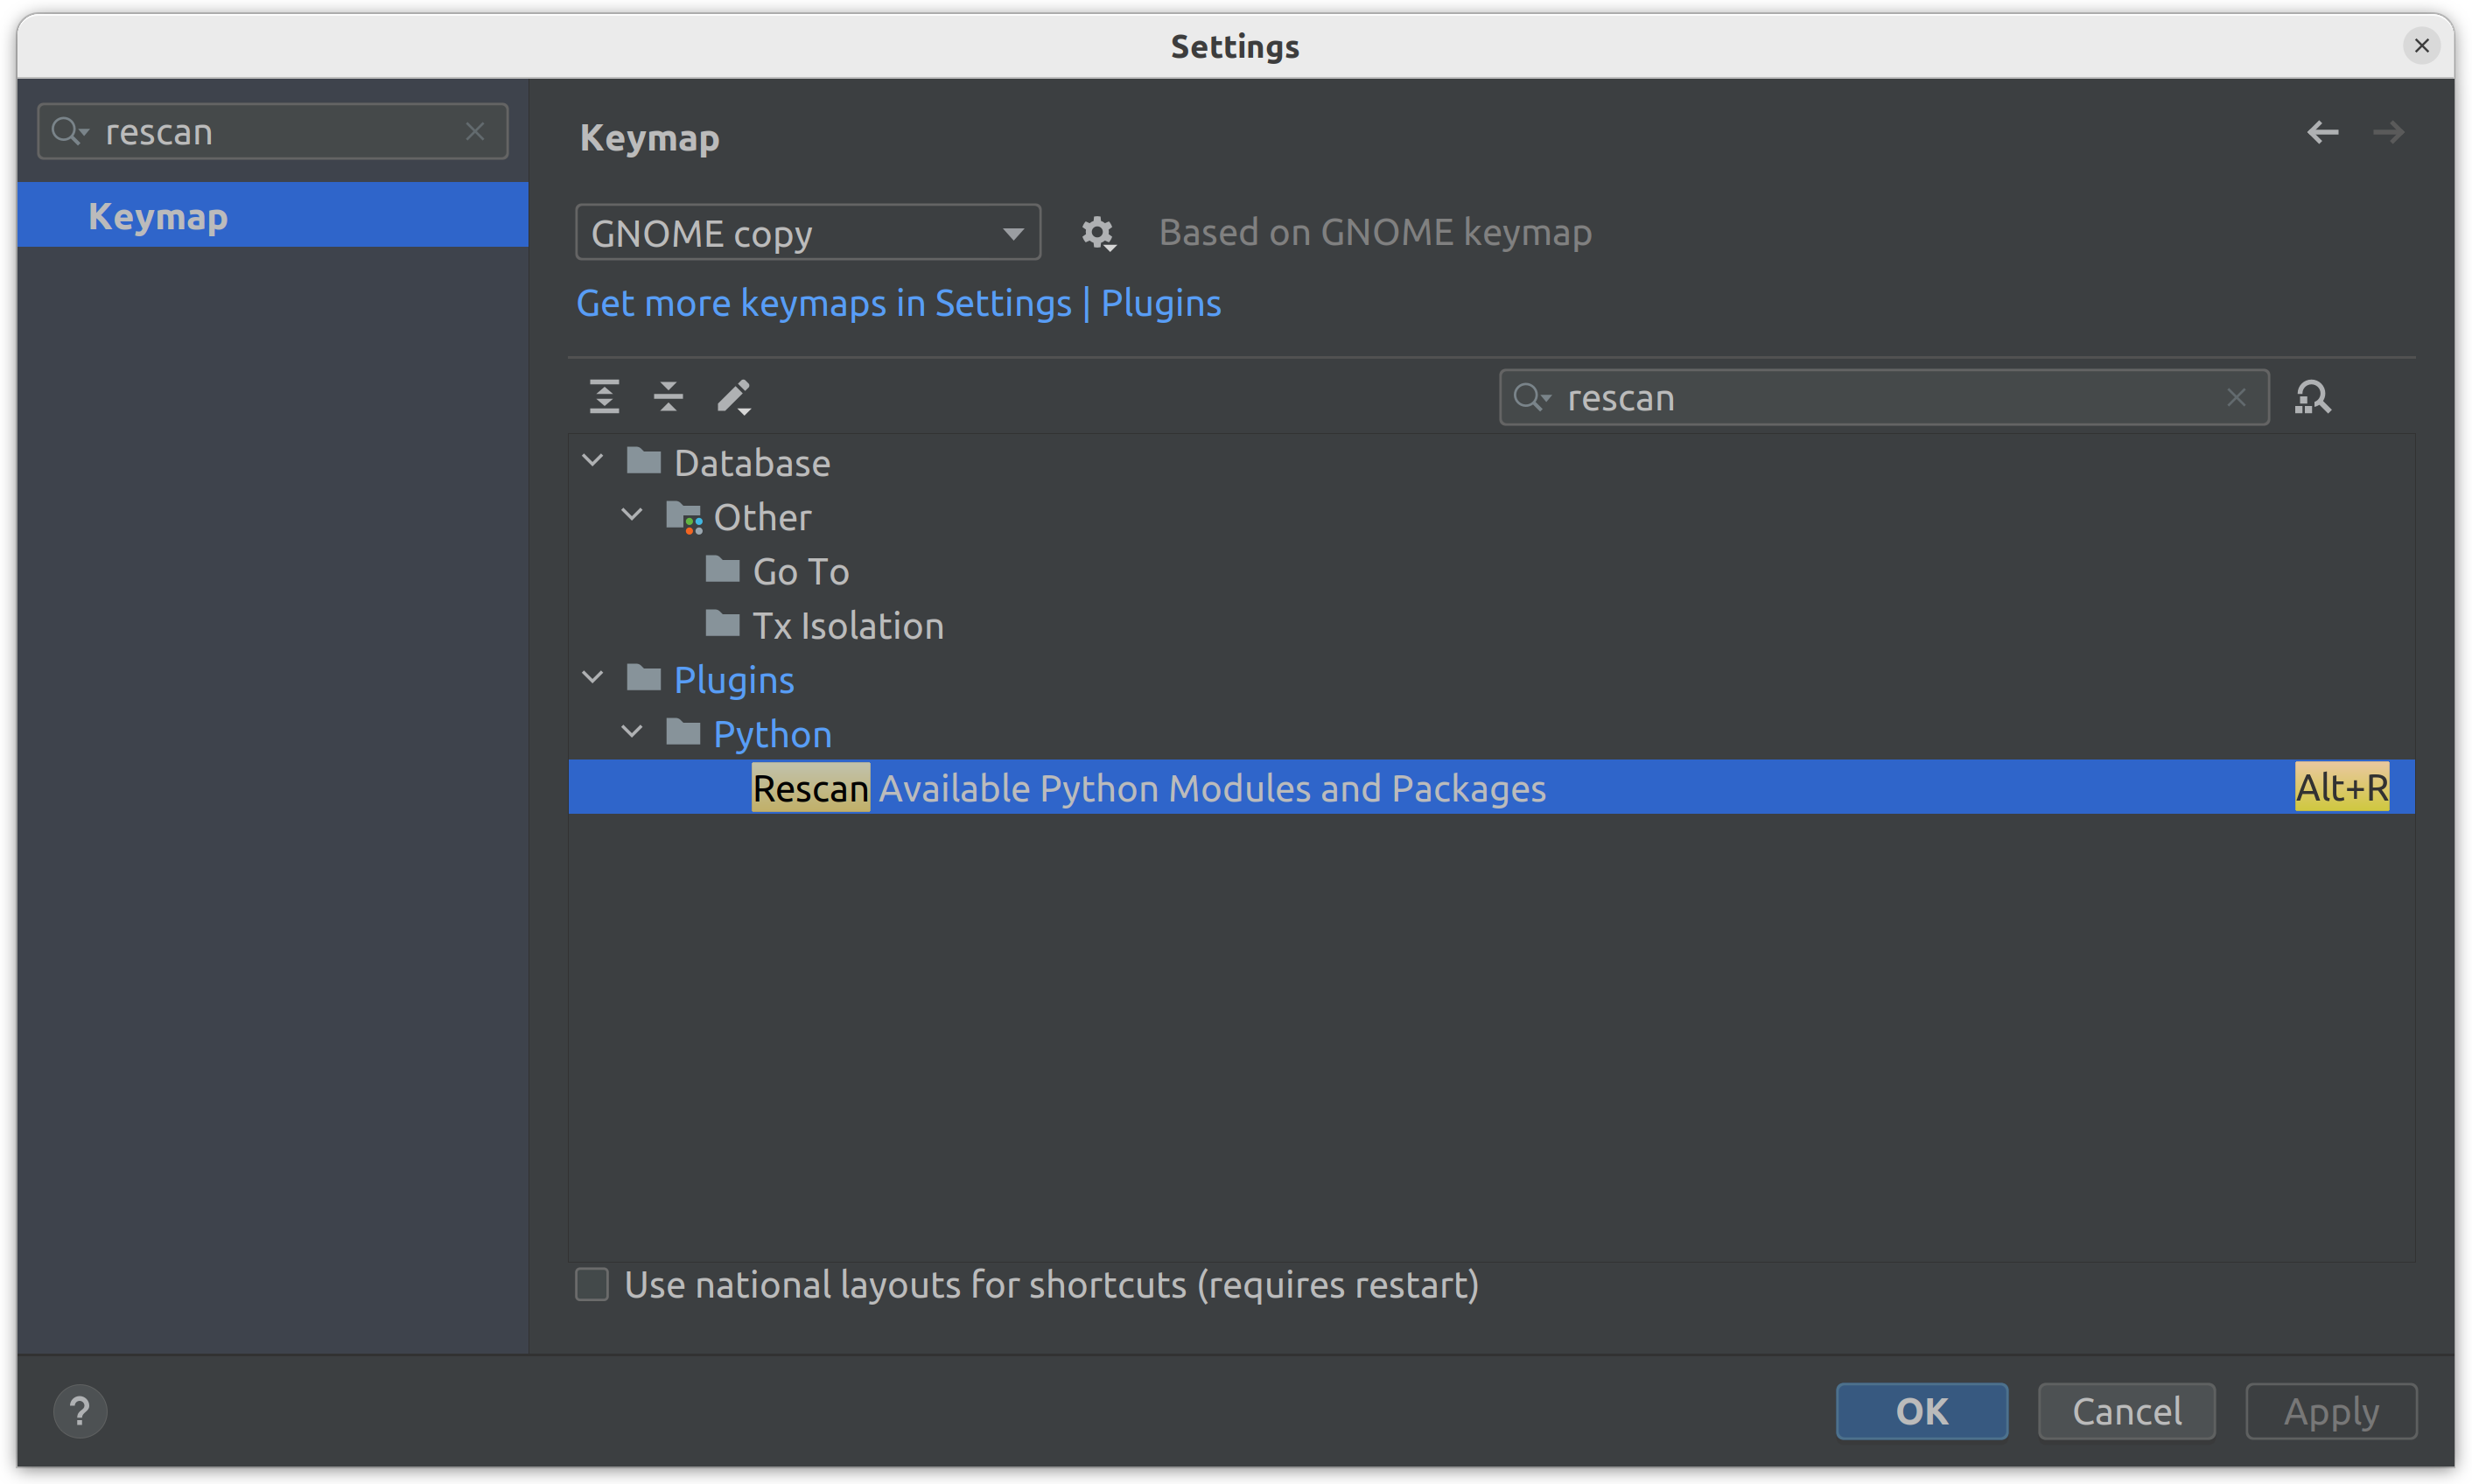
However, PyCharm does not automatically detect newly installed packages in the Docker container. The PyCharm will update the skeleton at the next startup or you can manually scan for new packages. To do this, you need to open the Settings and look for Rescan, then navigate to Plugins > Python > Rescan Available Python Modules and Packages and set the hotkey (e.g., Alt+R):
After adding a new package to the requirements.txt, simply press the specified hotkey to rebuild the image and update the packages.
VS Code
If any changes to the base image, module Dockerfile or requirements.txt are made, the container must be rebuilt.
Open the Command Palette with F1 or Ctrl+Shift+P.
Type
rebuildand select Dev Containers: Rebuild Container: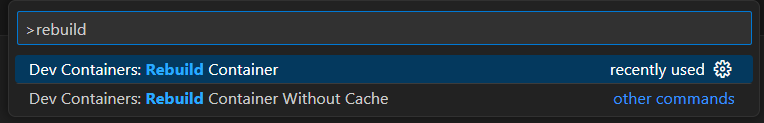
Wait until the container is rebuilt and the project is reopened.
Running The Module
If you carefully read the “Configure The Development Environment” section, you already know how to manage it.
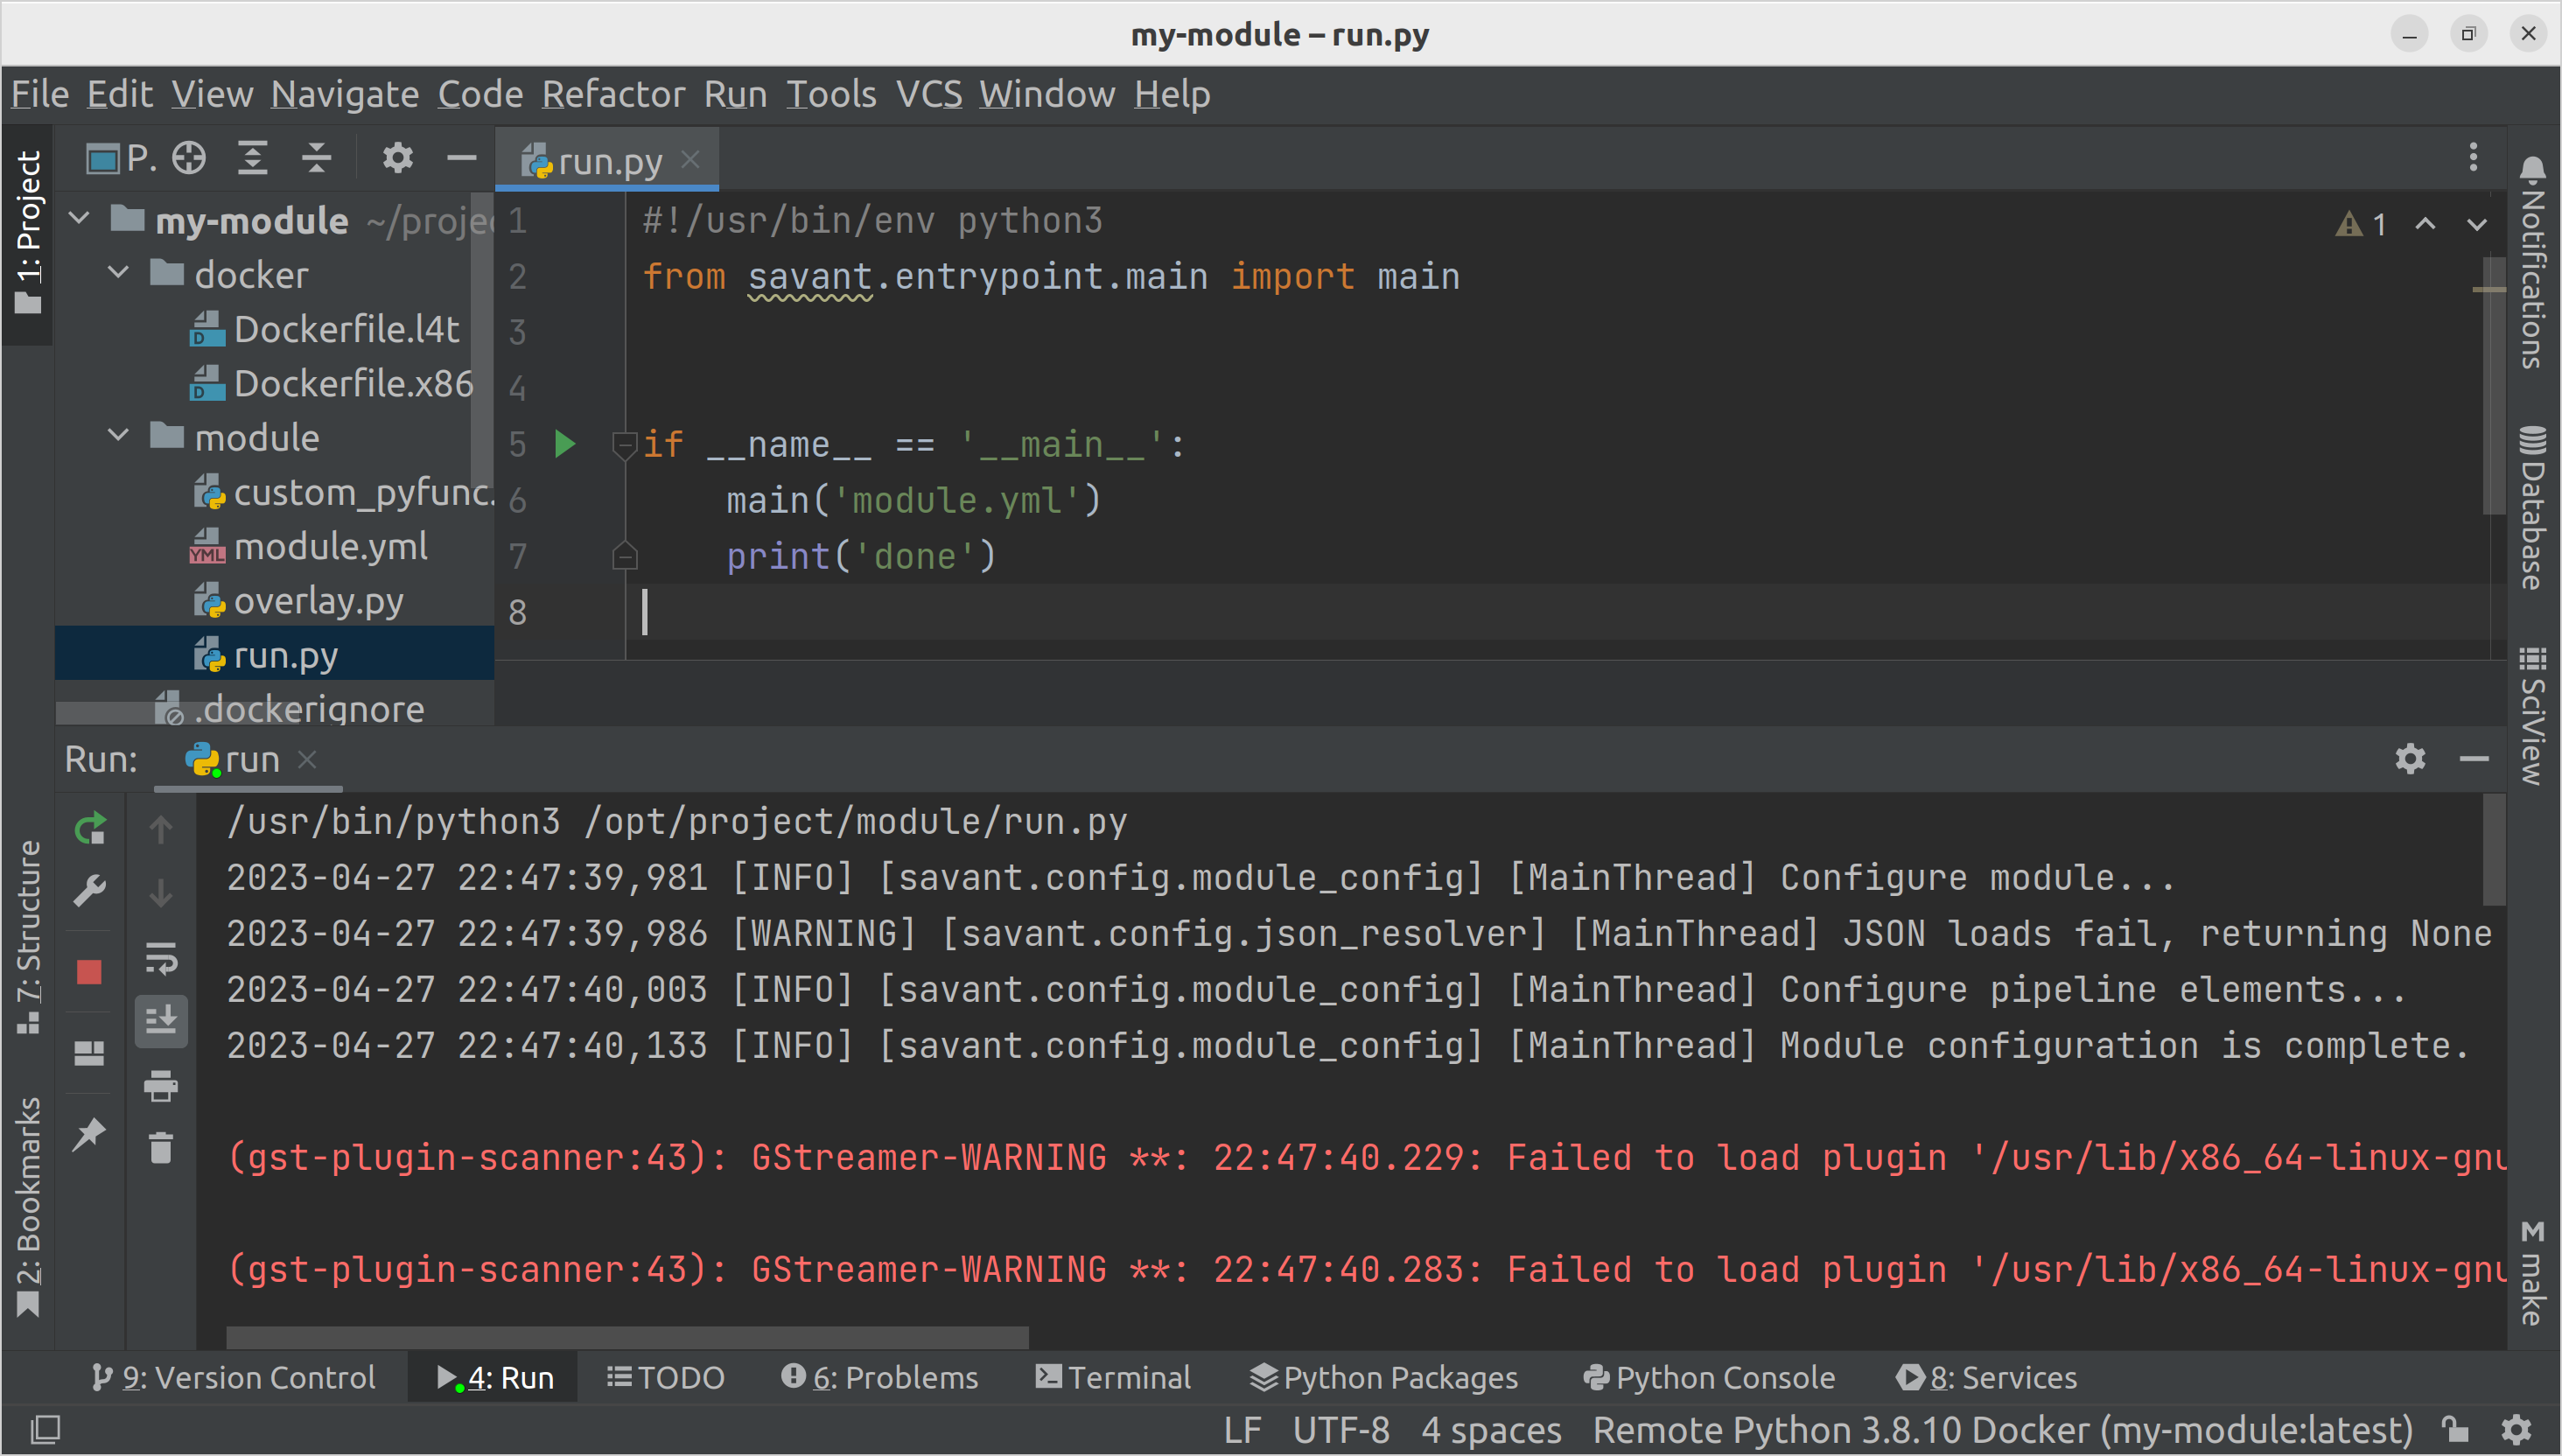
In PyCharm:
In VSCode:
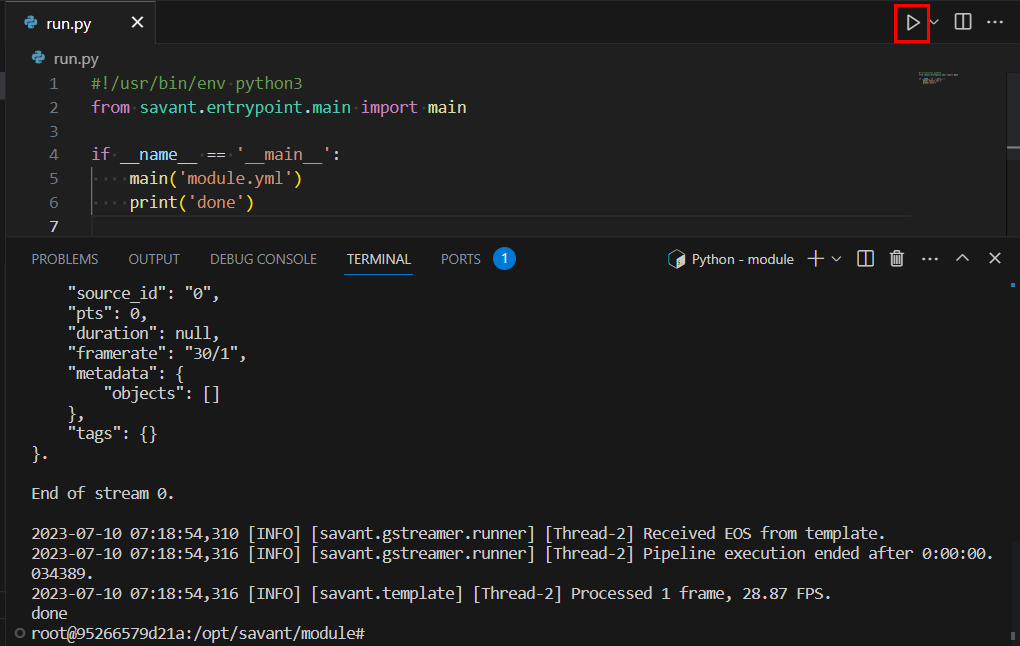
Also you can do it from the CLI like:
python /opt/project/module/run.py
Use IDEs controls to stop the module as usual.
You must use hard restarts when introducing changes in the module’s YAML manifest. The YAML manifest corresponds to the pipeline; Savant does not implement rebuilding the pipeline on change.
These starts/stops are time-consuming; we recommend building the development process to decrease the number of such restarts. From our perspective, it can be achieved by development iteratively (from the pipeline beginning to the pipeline end) following the waterfall principle.
Warning
We recommend avoiding the approach of defining the whole pipeline from scratch and debugging it end-to-end as a whole: it may be a very time-consuming and error-prone process. Define and troubleshoot pipeline stages one-by-one following the waterfall principle.
DevServer
DevServer is a special module execution mode enabling change detection in custom Python code and reloading those pieces automatically without the need for container restarts. It saves time significantly because code reloading happens instantly when the module processes the next frame after detecting the code change. Contrarily, manual restarts, described in the previous section, take many seconds because neural models must be loaded and initialized.
The mechanism currently has limitations:
It affects only the Python code specified in the module manifest, so additional dependencies imported in the main code are not checked for changes.
DevServer mode does not fit production use from the performance perspective; after the development is complete, disable the DevServer functionality.
Warning
Changes in YAML and other resources are ignored and do not cause code hot reloading.
The DevServer functionality can be enabled in the manifest by setting the parameter:
parameters:
  dev_mode: True
In the template module manifest the functionality is enabled by default.
Video Guide (VS Code)
OpenTelemetry Support
What is OpenTelemetry (from the official website). OpenTelemetry is a collection of APIs, SDKs, and tools. Use it to instrument, generate, collect, and export telemetry data (metrics, logs, and traces) to help you analyze your software’s performance and behavior.
Tip
Read an introductory article on OpenTelemetry in Savant on Medium.
Why To Use OpenTelemetry
In streaming systems, data flows through container stages in parallel what leads to messy logs with overlapping records for various messages. For example, when the message M[N] enters the pipeline, message M[N-P] passes the stage P, and their logs overlap.
For a developer, navigating through those logs without advanced filtering tools is very difficult. OpenTelemetry solves the problem by introducing the concept of Trace: a unique ID corresponding to a business transaction. In Savant, every frame coming in a pipeline can have a trace id, thus making it possible to separate logs related to a specific frame.
What is more, the Trace is not a flat structure: a developer can wrap certain pieces of code with so called Spans, limiting the scope, so logs are attached to the hierarchy of spans rather than Trace directly. Every span is automatically a profiling object because OpenTelemetry collects its start time, end time and duration.
Developers can attach auxiliary information to a span: attributes, events, span statuses.
Savant automatically creates spans for every pipeline stage and gives developer API to create nested spans in their Python code.
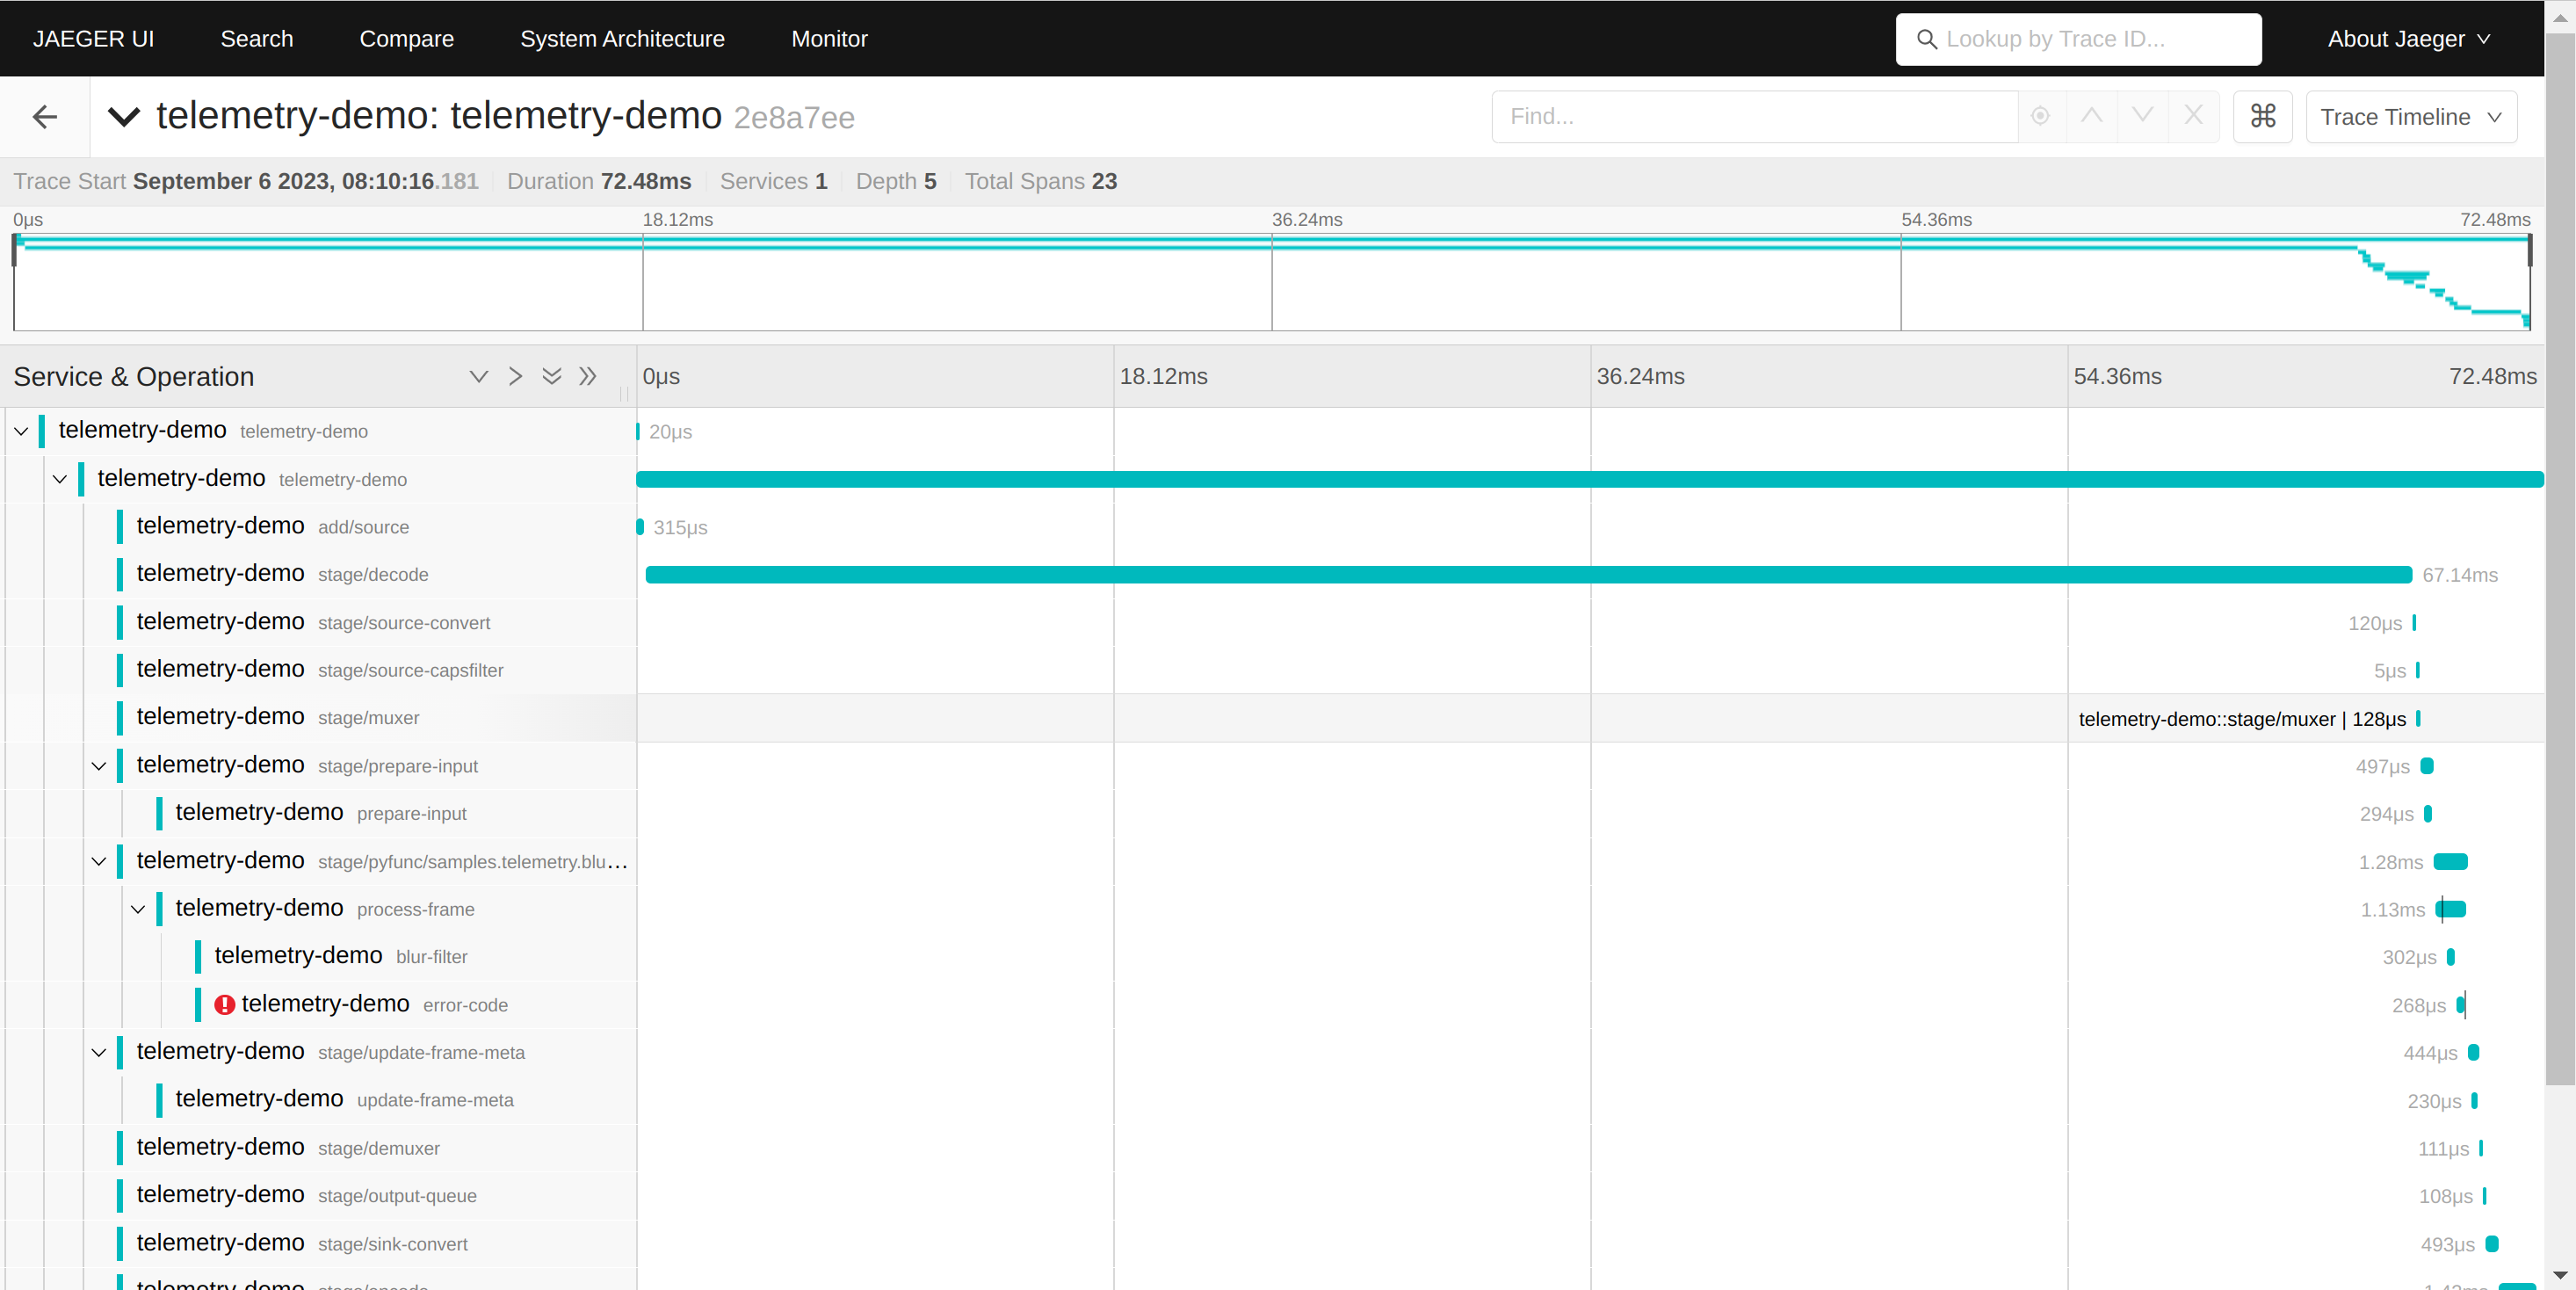
OpenTelemetry send tracing information to a trace collector. Currently, Savant integrates with Jaeger: a widely-used open-source tracing solution. Jaeger not only gathers traces but has RESTful API and WebUI to access and analyze tracing information.
OpenTelemetry Sampling
Sampling is an approach of statistically limiting the number of messages based on 1 of every N principle.
Depending on the sampling rate configured, the sampling fits both development/debug and production use. It allows combining code instrumenting with resource saving.
A particular case is when the sampling rate is set to 0: the pipeline module does not create traces at all but still serves externally propagated traces.
Trace Propagation
Trace propagation is a mechanism of passing traces between distributed, decoupled systems. Savant supports trace propagation.
OpenTelemetry Configuration
Use params.telemetry to configure OpenTelemetry for the module.
# base module parameters
parameters:
  # DevMode (hot Python code reload on file change)
  dev_mode: True

  # enable OpenTelemetry
  telemetry:
    sampling_period: 100
    root_span_name: pipeline
    provider: jaeger
    provider_params:
      service_name: demo-pipeline
      endpoint: jaeger:6831
Note
The module template already has valid configuration, considering that the Jaeger is launched in the all-in-one mode recommended on the Jaeger website:
docker run -d --name jaeger \
  -e COLLECTOR_ZIPKIN_HOST_PORT=:9411 \
  -p 6831:6831/udp \
  -p 6832:6832/udp \
  -p 5778:5778 \
  -p 16686:16686 \
  -p 4317:4317 \
  -p 4318:4318 \
  -p 14250:14250 \
  -p 14268:14268 \
  -p 14269:14269 \
  -p 9411:9411 \
  jaegertracing/all-in-one:1.48
Development With Client SDK
Client SDK is the most efficient approach to develop pipelines, run quality assurance tests to validate the pipeline behavior when models are under development, and to develop custom sources and sinks.
Client SDK together with DevServer and OpenTelemetry provide a complete set of technologies required to develop efficiently. Let us discuss why:
Client SDK allows sending a single frame from Python and retrieving the corresponding result. Because it is a Python code developers can use OpenCV to display the resulting frame, dumping meta to JSON, etc.
The Client SDK source sends every frame with OpenTelemetry propagated through the pipeline to the Client SDK sink, so developers can trace the code end-to-end and match frames sent with frames retrieved by Trace ID.
Client SDK can retrieve and display logs from Jaeger by a trace ID.
You can run the code directly from your IDE.
You can analyze code instrumenting in Jaeger Web GUI for every single query, which is beneficial for code optimization and debugging.
OpenTelemetry in Client SDK
Savant supports OpenTelemetry for collecting traces and logs. Frames, delivered to a module, can optionally include OpenTelemetry propagated information, which allows instrumenting pipelines precisely.
Note
In practice, we recommend using sampled OpenTelemetry traces; however, Client SDK creates a trace for every single frame sent to the module.
Client SDK integrates with OpenTelemetry, which means that every time a frame is sent to a module, it contains a new trace, thus the trace causes the module to instrument its internal parts, creating necessary OpenTelemetry spans in the pipeline, including pyfuncs. The developer can create auxiliary spans within her code to find out what happens. Please, refer to OpenTelemetry Support for details.
During the frame processing ongoing logs are attached to the currently active span and thus collected and associated with a specific trace. The developer also can attach additional information to the trace by calling corresponding span methods.
When the frame is sent, the savant.client.runner.source.SourceResult is returned. The developer can retrieve the trace_id from it for matching sent and delivered frames.
Note
The trace_id can also be used to observe the trace in the Opentelemetry management system like Jaeger.
When the frame processing result is retrieved from the module, the developer can request the frame, metadata and logs collected by OpenTelemetry.
Currently we support only Jaeger OpenTelemetry collector. Logs are fetched from Jaeger REST API.
Remote Development
Client SDK enables remote development, allowing running programmatic sources and sinks locally, while processing the data remotely. It can be convenient in the following cases:
develop on a host machine without GPU;
develop on remote hardware with no KVM access (e.g. Jetson or dGPU in a datacenter).
To utilize the full power of Client SDK it must be paired with:
To find out more, explore Module Development Guide.
Source Example
Sources ingest frames and their metadata to a running module.
Note
Currently, Client SDK supports only JPEG source, but you can implement your own source based on savant.client.JpegSource.
import time
from savant_rs import init_jaeger_tracer
from savant.client import JaegerLogProvider, JpegSource, SourceBuilder

# Initialize Jaeger tracer to send metrics and logs to Jaeger.
# Note: the Jaeger tracer also should be configured in the module.
init_jaeger_tracer('savant-client', 'localhost:6831')

# Build the source
source = (
    SourceBuilder()
    .with_log_provider(JaegerLogProvider('http://localhost:16686'))
    .with_socket('pub+connect:ipc:///tmp/zmq-sockets/input-video.ipc')
    # Note: healthcheck port should be configured in the module.
    .with_module_health_check_url('http://module:8888/healthcheck')
    .build()
)

# Send a JPEG image from a file to the module
result = source(JpegSource('cam-1', 'data/AVG-TownCentre.jpeg'))
print(result.status)
time.sleep(1)  # Wait for the module to process the frame
result.logs().pretty_print()
Sink Example
Sinks retrieve results from a module.
from savant.client import JaegerLogProvider, SinkBuilder

# Build the sink
sink = (
    SinkBuilder()
    .with_socket('sub+connect:ipc:///tmp/zmq-sockets/output-video.ipc')
    .with_idle_timeout(60)
    .with_log_provider(JaegerLogProvider('http://localhost:16686'))
    # Note: healthcheck port should be configured in the module.
    .with_module_health_check_url('http://module:8888/healthcheck')
    .build()
)

# Receive results from the module and print them
for result in sink:
    print(result.frame_meta)
    result.logs().pretty_print()
Using uri-input.py Script
The video demonstrates how to use uri-input.py to submit a video file to the module, and display its contents with the Always-On RTSP Sink Adapter.
Summary
TODO