OpenTelemetry Support
What is OpenTelemetry (from the official website). OpenTelemetry is a collection of APIs, SDKs, and tools. Use it to instrument, generate, collect, and export telemetry data (metrics, logs, and traces) to help you analyze your software’s performance and behavior.
Tip
Read an introductory article on OpenTelemetry in Savant on Medium.
Why To Use OpenTelemetry
In streaming systems, data flows through container stages in parallel what leads to messy logs with overlapping records for various messages. For example, when the message M[N] enters the pipeline, message M[N-P] passes the stage P, and their logs overlap.
For a developer, navigating through those logs without advanced filtering tools is very difficult. OpenTelemetry solves the problem by introducing the concept of Trace: a unique ID corresponding to a business transaction. In Savant, every frame coming in a pipeline can have a trace id, thus making it possible to separate logs related to a specific frame.
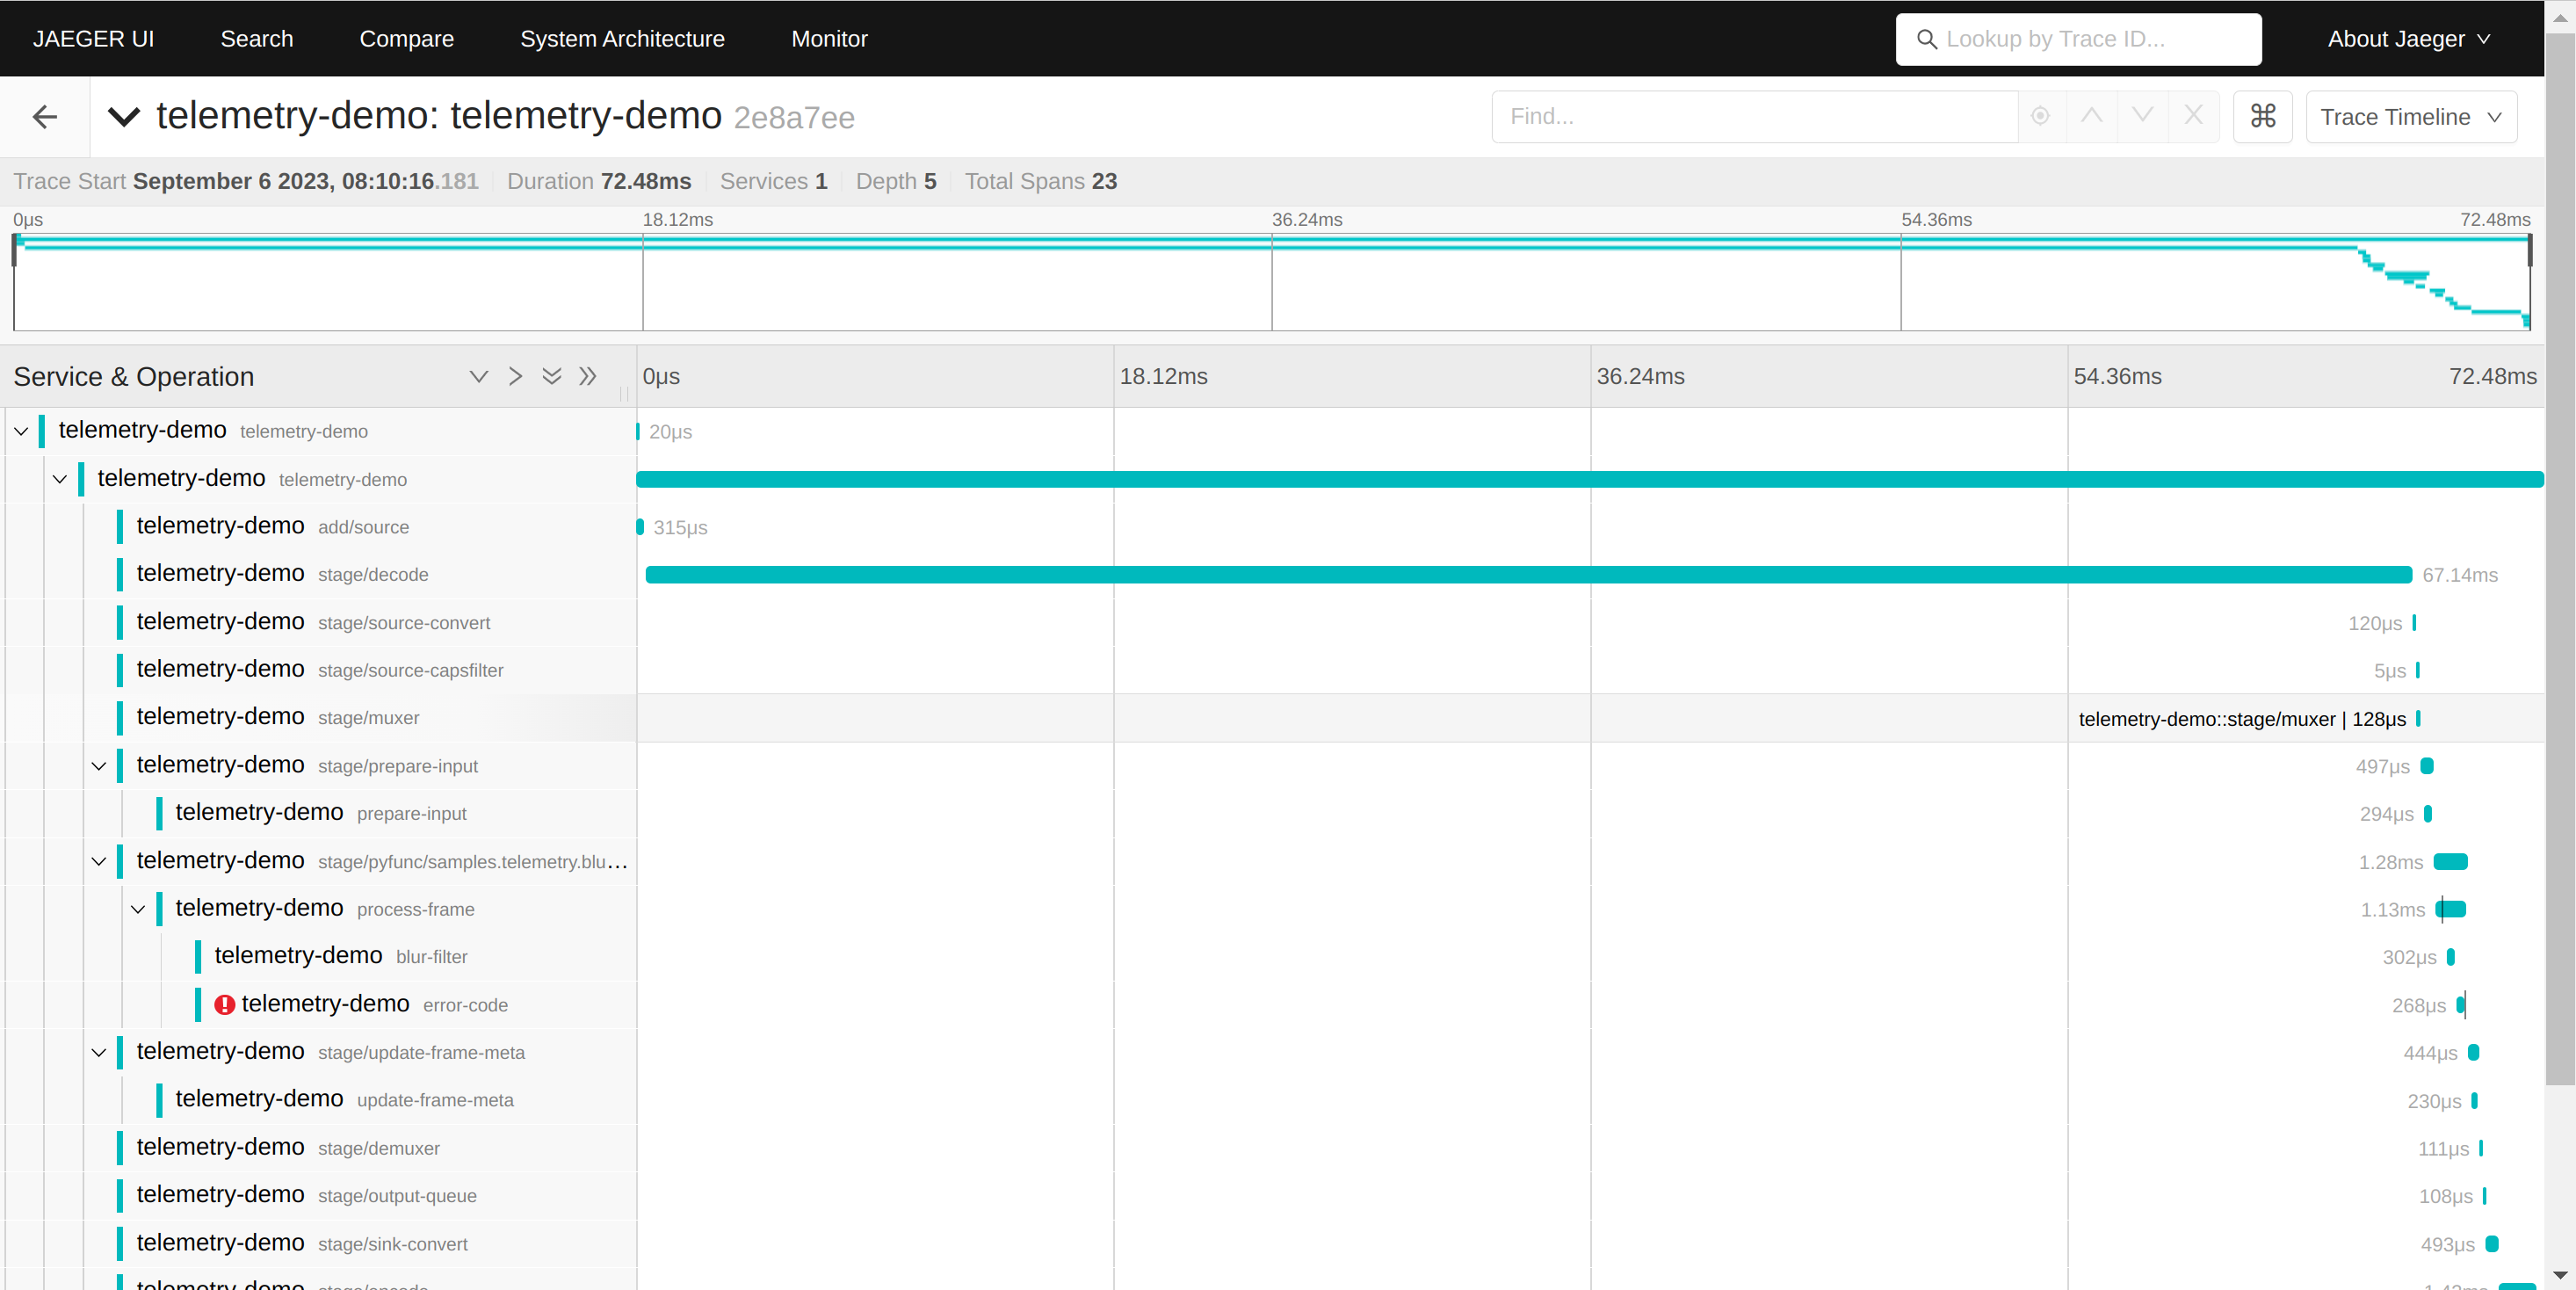
What is more, the Trace is not a flat structure: a developer can wrap certain pieces of code with so called Spans, limiting the scope, so logs are attached to the hierarchy of spans rather than Trace directly. Every span is automatically a profiling object because OpenTelemetry collects its start time, end time and duration.
Developers can attach auxiliary information to a span: attributes, events, span statuses.
Savant automatically creates spans for every pipeline stage and gives developer API to create nested spans in their Python code.
OpenTelemetry send tracing information to a trace collector. Currently, Savant integrates with Jaeger: a widely-used open-source tracing solution. Jaeger not only gathers traces but has RESTful API and WebUI to access and analyze tracing information.
OpenTelemetry Sampling
Sampling is an approach of statistically limiting the number of messages based on 1 of every N principle.
Depending on the sampling rate configured, the sampling fits both development/debug and production use. It allows combining code instrumenting with resource saving.
A particular case is when the sampling rate is set to 0: the pipeline module does not create traces at all but still serves externally propagated traces.
Trace Propagation
Trace propagation is a mechanism of passing traces between distributed, decoupled systems. Savant supports trace propagation.
OpenTelemetry Configuration
Use params.telemetry to configure OpenTelemetry for the module.
# base module parameters
parameters:
  # DevMode (hot Python code reload on file change)
  dev_mode: True

  # enable OpenTelemetry
  telemetry:
    sampling_period: 100
    root_span_name: pipeline
    provider: jaeger
    provider_params:
      service_name: demo-pipeline
      endpoint: jaeger:6831
Note
The module template already has valid configuration, considering that the Jaeger is launched in the all-in-one mode recommended on the Jaeger website:
docker run -d --name jaeger \
  -e COLLECTOR_ZIPKIN_HOST_PORT=:9411 \
  -p 6831:6831/udp \
  -p 6832:6832/udp \
  -p 5778:5778 \
  -p 16686:16686 \
  -p 4317:4317 \
  -p 4318:4318 \
  -p 14250:14250 \
  -p 14268:14268 \
  -p 14269:14269 \
  -p 9411:9411 \
  jaegertracing/all-in-one:1.48